With the Charts node, you can launch the chart builder and create chart definitions to
save with your flow. Then when you run the node, chart output is generated.
The Charts node is available under the Graphs section on the node palette. After adding a Charts
node to your flow, double-click it to open the properties pane. Then click Launch Chart
Builder to open the chart builder and create one or more chart definitions to associate
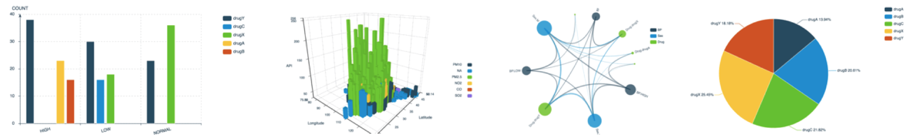
with the node. See Visualizing your data for details about creating charts.Figure 1. Example charts
Notes:
When you create a chart, it uses a sample of your data. After clicking Save and
close to save the chart definition and return to your flow, the Charts node will then
use all of your data when you run it.
Chart definitions are listed in the node properties panel, with icons available for editing them
or removing them.
When you run a Charts node, the defined chart (or charts) is built and added to the
Outputs pane. Open the chart output to interact with it by hovering over
it, zooming in or out, or downloading the chart as an image file
(.png).
When creating a chart, you can click Back to flow to close the chart
builder and return to your flow. But you can't run the Charts node until you save a chart
definition.
Scripting example
This example creates a Charts node and sets the chart
definitions:
Use this interactive map to learn about the relationships between your tasks, the tools you need, the services that provide the tools, and where you use the tools.
Select any task, tool, service, or workspace
You'll learn what you need, how to get it, and where to use it.
Tasks you'll do
Some tasks have a choice of tools and services.
Tools you'll use
Some tools perform the same tasks but have different features and levels of automation.
Create a notebook in which you run Python, R, or Scala code to prepare, visualize, and analyze data, or build a model.
Automatically analyze your tabular data and generate candidate model pipelines customized for your predictive modeling problem.
Create a visual flow that uses modeling algorithms to prepare data and build and train a model, using a guided approach to machine learning that doesn’t require coding.
Create and manage scenarios to find the best solution to your optimization problem by comparing different combinations of your model, data, and solutions.
Create a flow of ordered operations to cleanse and shape data. Visualize data to identify problems and discover insights.
Automate the model lifecycle, including preparing data, training models, and creating deployments.
Work with R notebooks and scripts in an integrated development environment.
Create a federated learning experiment to train a common model on a set of remote data sources. Share training results without sharing data.
Deploy and run your data science and AI solutions in a test or production environment.
Find and share your data and other assets.
Import asset metadata from a connection into a project or a catalog.
Enrich imported asset metadata with business context, data profiling, and quality assessment.
Measure and monitor the quality of your data.
Create and run masking flows to prepare copies of data assets that are masked by advanced data protection rules.
Create your business vocabulary to enrich assets and rules to protect data.
Track data movement and usage for transparency and determining data accuracy.
Track AI models from request to production.
Create a flow with a set of connectors and stages to transform and integrate data. Provide enriched and tailored information for your enterprise.
Create a virtual table to segment or combine data from one or more tables.
Measure outcomes from your AI models and help ensure the fairness, explainability, and compliance of all your models.
Replicate data to target systems with low latency, transactional integrity and optimized data capture.
Consolidate data from the disparate sources that fuel your business and establish a single, trusted, 360-degree view of your customers.
Services you can use
Services add features and tools to the platform.
Develop powerful AI solutions with an integrated collaborative studio and industry-standard APIs and SDKs. Formerly known as Watson Studio.
Quickly build, run and manage generative AI and machine learning applications with built-in performance and scalability. Formerly known as Watson Machine Learning.
Discover, profile, catalog, and share trusted data in your organization.
Create ETL and data pipeline services for real-time, micro-batch, and batch data orchestration.
View, access, manipulate, and analyze your data without moving it.
Monitor your AI models for bias, fairness, and trust with added transparency on how your AI models make decisions.
Provide efficient change data capture and near real-time data delivery with transactional integrity.
Improve trust in AI pipelines by identifying duplicate records and providing reliable data about your customers, suppliers, or partners.
Increase data pipeline transparency so you can determine data accuracy throughout your models and systems.
Where you'll work
Collaborative workspaces contain tools for specific tasks.
Where you work with data.
> Projects > View all projects
Where you find and share assets.
> Catalogs > View all catalogs
Where you deploy and run assets that are ready for testing or production.
> Deployments
Where you manage governance artifacts.
> Governance > Categories
Where you virtualize data.
> Data > Data virtualization
Where you consolidate data into a 360 degree view.