Field. Specify value and field labels for data in watsonx.ai Studio. For example, field metadata imported from a
data asset can be viewed or modified here. Similarly, you can create new labels for fields and their
values.
Measure. This is the measurement level, used to describe characteristics
of the data in a given field. If all the details of a field are known, it's called fully
instantiated.
Note: The measurement
level of a field is different from its storage type, which indicates whether the data is stored as
strings, integers, real numbers, dates, times, timestamps, or lists.
Role. Used to tell modeling nodes whether fields will be
Input (predictor fields) or Target (predicted fields)
for a machine-learning process. Both and None are also
available roles, along with Partition, which indicates a field used to
partition records into separate samples for training, testing, and validation. The value
Split specifies that separate models will be built for each possible value of
the field.
Value mode. Use this column to specify options for reading data values
from the dataset, or use the Specify option to specify measurement levels and
values.
Values. With this column, you can specify options for reading data values
from the data set, or specify measurement levels and values separately. You can also choose to pass
fields without reading their values. You can't amend the cell
in this column if the corresponding Field entry contains a list.
Check. With this column, you can set options to ensure that field values
conform to the specified values or ranges. You can't
amend the cell in this column if the corresponding Field entry contains a
list.
Click the Edit (gear) icon next to each row to open additional
options.
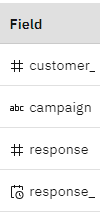
Tip: Icons in the Type node properties quickly indicate the data type of each field,
such as string, date, double integer, or hashtag.Figure 1. New Type node icons
Was the topic helpful?
0/1000
Focus sentinel
Focus sentinel
Focus sentinel
Focus sentinel
Focus sentinel
Cloud Pak for Data relationship map
Use this interactive map to learn about the relationships between your tasks, the tools you need, the services that provide the tools, and where you use the tools.
Select any task, tool, service, or workspace
You'll learn what you need, how to get it, and where to use it.
Tasks you'll do
Some tasks have a choice of tools and services.
Tools you'll use
Some tools perform the same tasks but have different features and levels of automation.
Create a notebook in which you run Python, R, or Scala code to prepare, visualize, and analyze data, or build a model.
Automatically analyze your tabular data and generate candidate model pipelines customized for your predictive modeling problem.
Create a visual flow that uses modeling algorithms to prepare data and build and train a model, using a guided approach to machine learning that doesn’t require coding.
Create and manage scenarios to find the best solution to your optimization problem by comparing different combinations of your model, data, and solutions.
Create a flow of ordered operations to cleanse and shape data. Visualize data to identify problems and discover insights.
Automate the model lifecycle, including preparing data, training models, and creating deployments.
Work with R notebooks and scripts in an integrated development environment.
Create a federated learning experiment to train a common model on a set of remote data sources. Share training results without sharing data.
Deploy and run your data science and AI solutions in a test or production environment.
Find and share your data and other assets.
Import asset metadata from a connection into a project or a catalog.
Enrich imported asset metadata with business context, data profiling, and quality assessment.
Measure and monitor the quality of your data.
Create and run masking flows to prepare copies of data assets that are masked by advanced data protection rules.
Create your business vocabulary to enrich assets and rules to protect data.
Track data movement and usage for transparency and determining data accuracy.
Track AI models from request to production.
Create a flow with a set of connectors and stages to transform and integrate data. Provide enriched and tailored information for your enterprise.
Create a virtual table to segment or combine data from one or more tables.
Measure outcomes from your AI models and help ensure the fairness, explainability, and compliance of all your models.
Replicate data to target systems with low latency, transactional integrity and optimized data capture.
Consolidate data from the disparate sources that fuel your business and establish a single, trusted, 360-degree view of your customers.
Services you can use
Services add features and tools to the platform.
Develop powerful AI solutions with an integrated collaborative studio and industry-standard APIs and SDKs. Formerly known as Watson Studio.
Quickly build, run and manage generative AI and machine learning applications with built-in performance and scalability. Formerly known as Watson Machine Learning.
Discover, profile, catalog, and share trusted data in your organization.
Create ETL and data pipeline services for real-time, micro-batch, and batch data orchestration.
View, access, manipulate, and analyze your data without moving it.
Monitor your AI models for bias, fairness, and trust with added transparency on how your AI models make decisions.
Provide efficient change data capture and near real-time data delivery with transactional integrity.
Improve trust in AI pipelines by identifying duplicate records and providing reliable data about your customers, suppliers, or partners.
Increase data pipeline transparency so you can determine data accuracy throughout your models and systems.
Where you'll work
Collaborative workspaces contain tools for specific tasks.
Where you work with data.
> Projects > View all projects
Where you find and share assets.
> Catalogs > View all catalogs
Where you deploy and run assets that are ready for testing or production.
> Deployments
Where you manage governance artifacts.
> Governance > Categories
Where you virtualize data.
> Data > Data virtualization
Where you consolidate data into a 360 degree view.